This infographic is one example of what a classroom activity with the Random Ethnographic Vignette Printer can produce.
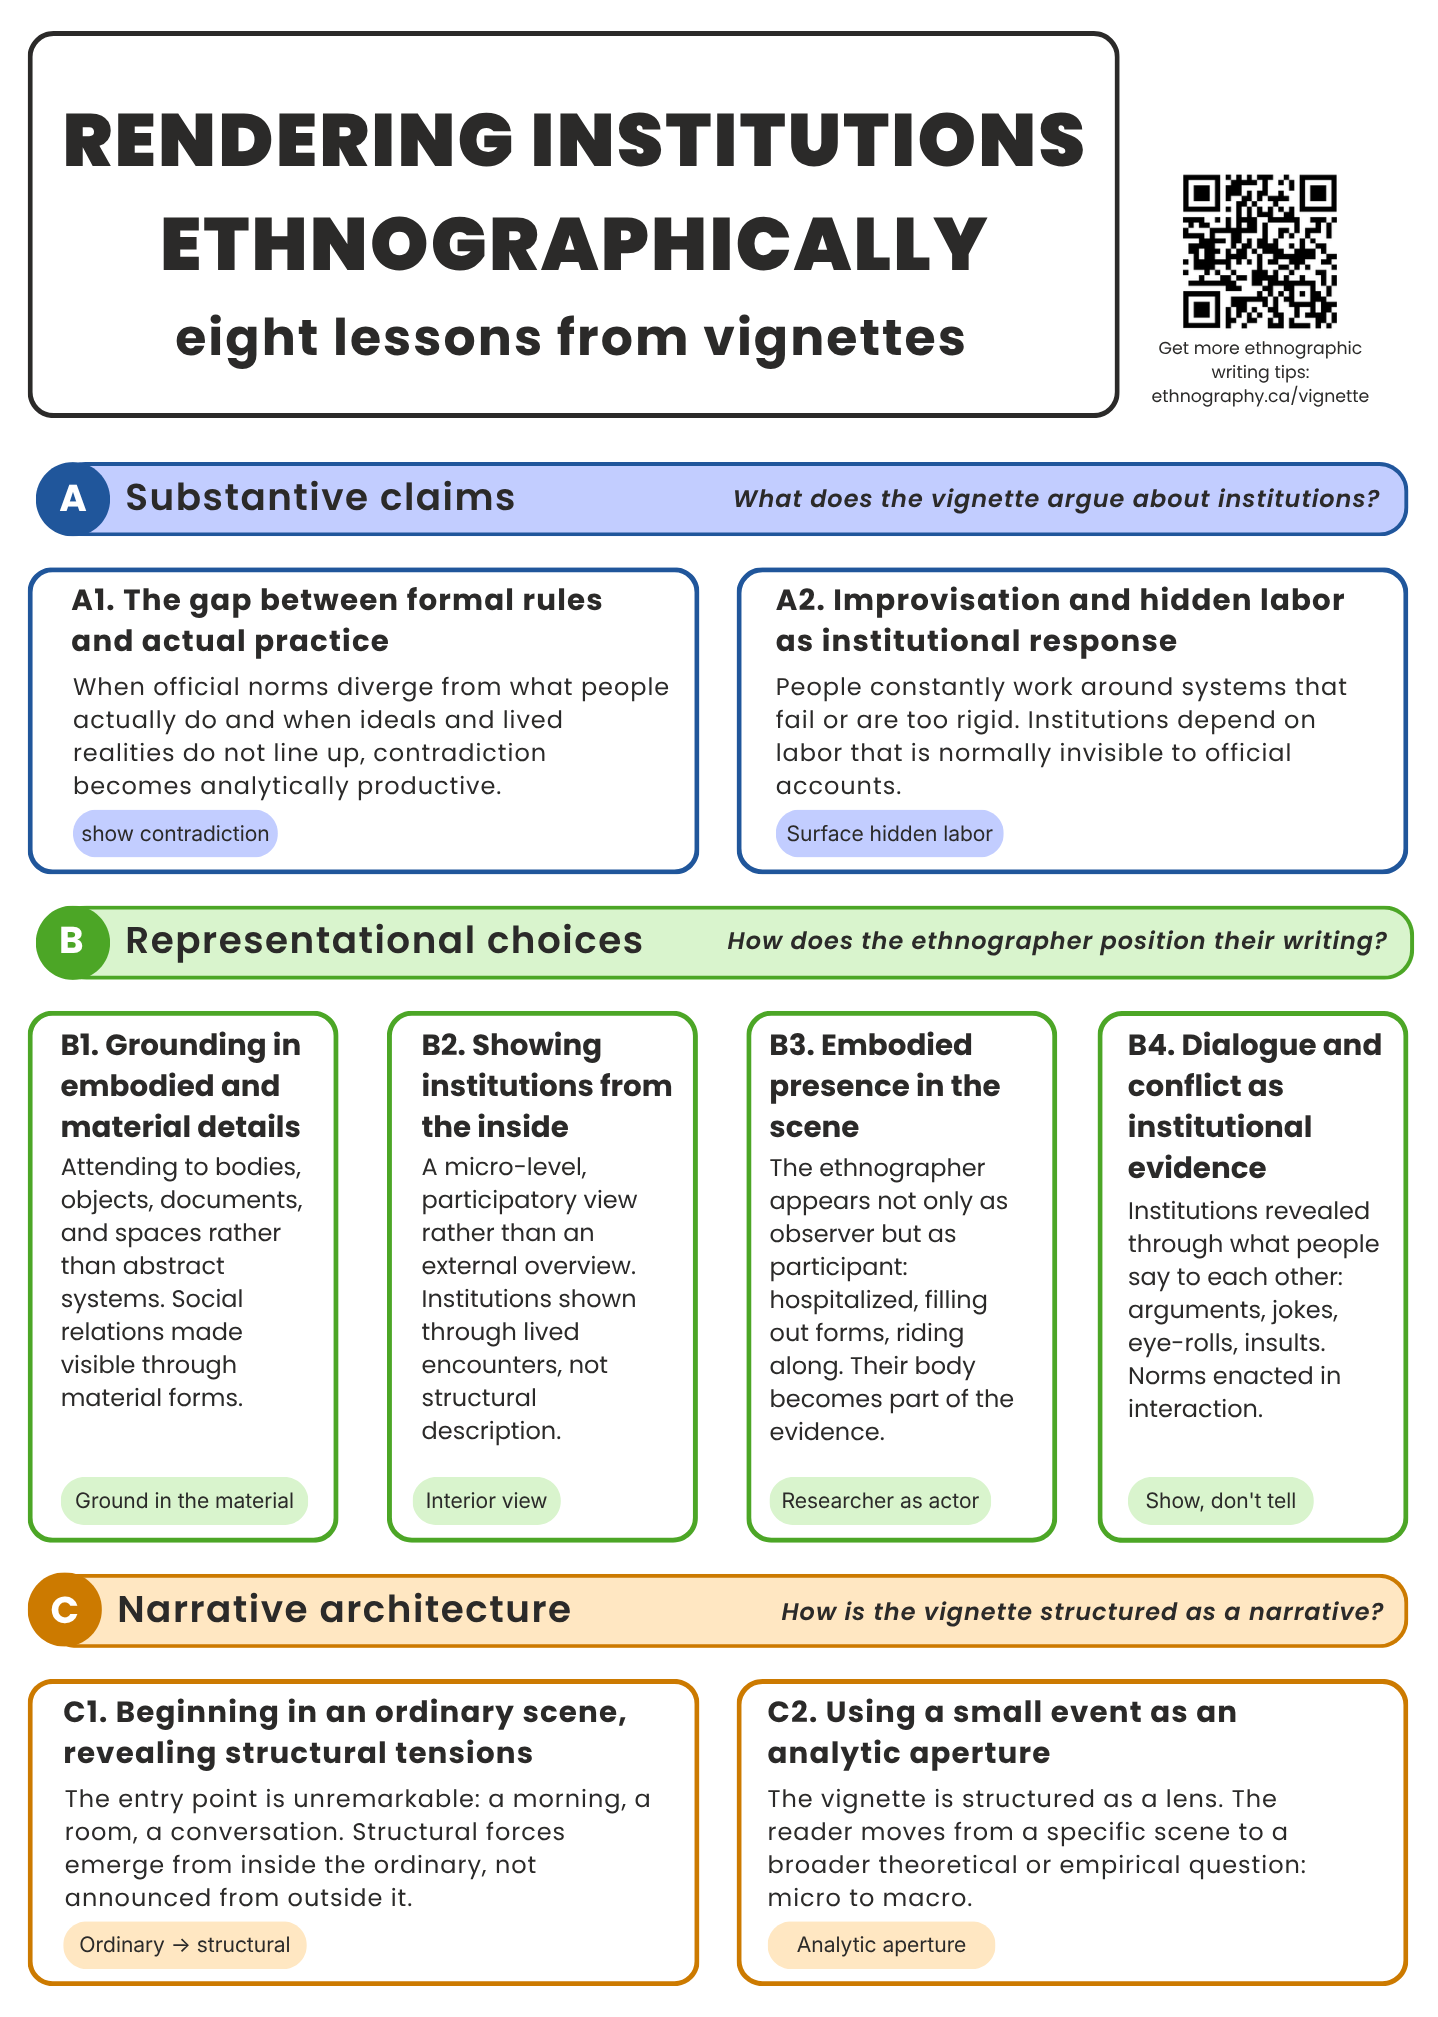
During an urban ethnographic field school, students each used the Printer to draw a set of vignettes from the tool's database, all randomly selected from a subset focused on institutions and organizations. Rather than working from a shared, pre-assigned text, each student received a unique printout: a different vignette, a different ethnographic voice, a different context. Working with their individual receipts, students analyzed each vignette for its narrative strategies and the arguments it makes about institutional life and how institutions are depicted, how they are entered, and what they reveal. They then brought their analyses together, collaboratively identifying recurring patterns and organizing them into categories.
The eight lessons in this framework are the result of that collective work. I did not use a framework imposed in advance. It emerged from close, distributed reading. The infographic organizes student findings across three dimensions: the substantive claims the vignettes make about institutions, the representational choices they model for ethnographic writers, and the narrative architecture through which those choices are structured.
The activity was timed deliberately: students were preparing to write ethnographic accounts of the community organizations they had been paired with for the field school. The infographic gave them a concrete set of writing strategies drawn from published ethnography: a resource built from their own analysis, just as they were about to put those strategies to use.